Realization of a 1 Digit and 2 Digits Digital Frequencemeter :
9. - SIXTH EXPERIENCE : REALIZING A DIGITAL FREQUENCEMETER TO A NUMBER
The digital measurement of a frequency is generally more accurate than the analog measurement.
To perform a digital frequency measurement, it is sufficient to count the number of periods of the signal during a given time.
The frequency being the number of periods per second, so just count the number of cycles for one second, as shown in Figure 23.
For this purpose, an ordinary counter is used on the CLOCK input of which the rectangular signal is applied. A control signal is used to start counting and stop after one second. If the frequency is 4 Hz (Figure 23), the counter will record four pulses.
9. 1. - REALIZATION OF THE CIRCUIT
a) Remove from the matrix all components and links related to the previous experiment.
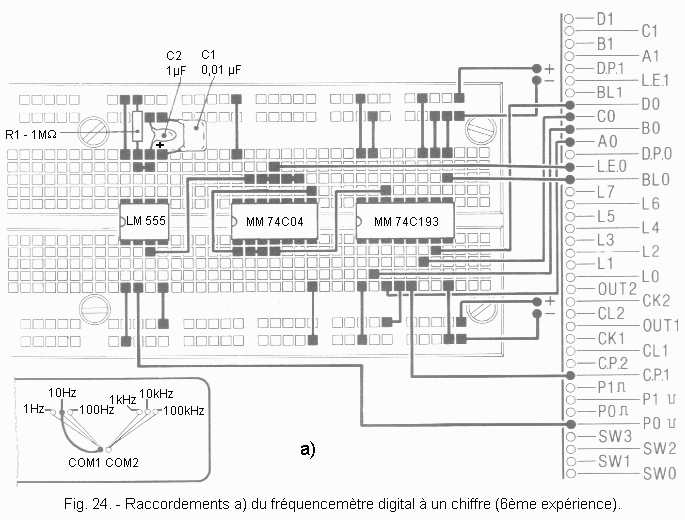
b) Perform the assembly shown in Figure 24-a.
c) Prepare the Digilab generator on the frequency of 10 Hz.
The electrical diagram of the realized circuit is shown in Figure 24-b.
The LM 555 integrated circuit is monostable and the pulse it generates lasts about 1 second.
It allows to validate the counter MM 74C193 for 1 second thanks to its entry CLEAR.
The signal whose frequency is to be measured is applied to the COUNT UP input of the counter.
The result of the count is displayed on DIS0 which is connected to the outputs QA, QB, QC and QD of the counter.
9. 2. - OPERATING TEST
a) Turn on the Digilab.
b) Press P0 and release it immediately.
You will scroll through the digits 0 to 9 on the display and the display will stop at the number A, which corresponds to 10.
This indicates that the applied signal frequency is 10 Hz.
It is possible that the display shows a value quite different from 10 Hz. First, the duration of the pulse of the monostable may be slightly different from 1 second and secondly, the accuracy of the frequency of the signal of Digilab clock is not very high.
You can also perform one of the astable fixtures in Practice 7 and measure the frequency of the output signal.
Nevertheless, you will be limited to 15 Hz.
c) With this experiment completed, turn off the Digilab.
The block diagram in Figure 25 allows you to understand the operation of the frequency meter.
By pressing P0, the monostable is triggered and delivers a pulse of 1 second which validates the counter, which counts the pulses that reach it on its input COUNT UP.
The pulse from the LM 555 also controls the LATCH lock input of the DIS0 display.
The timing diagram of Figure 26 shows the evolution of voltages at different points of the assembly.
The output signal of the LM 555 is inverted and applied to the LATCH lock input (LE0) of the DIS0 display. This signal which reaches the LATCH input is then inverted four times in succession, which makes it possible to have an identical signal on the LATCH inputs of the display and the CLEAR of the counter. The one arriving at the CLEAR input has a certain delay caused by the 4 inverting gates with respect to the signal applied on the LATCH input of the display. Indeed, it is necessary that the reset of the counter is done after the display lock.
When the signal LE0 goes from state 0 to state 1, the DIS0 display stores the contents of the counter, the latter being reset to zero until a certain time after this storage of the content of the counter.
10. - SEVENTH EXPERIENCE : REALIZATION OF A DIGITAL FREQUENCEMETER
WITH TWO FIGURES
The circuit you will achieve is very similar to the previous one. Nevertheless, it has better performance in terms of frequency measurement. First, the measurement is automatic and repetitive, then the result is displayed on two digits. However, this montage does not claim to be a laboratory device but only a didactic circuit.
10. 1. - REALIZATION OF THE CIRCUIT
a) Remove from the matrix all the links and components related to the previous experiment.
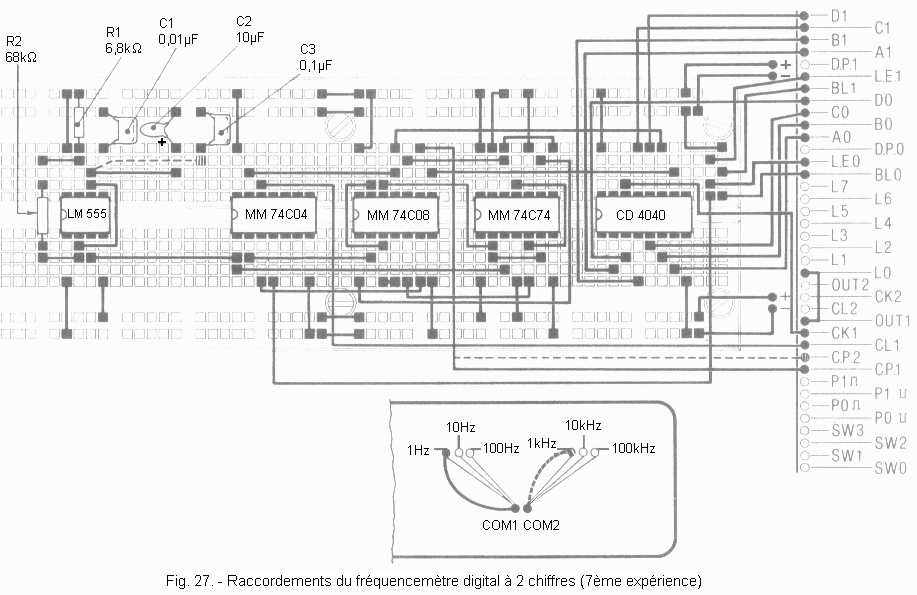
b) Insert on the matrix the integrated circuits CD4040, MM74C74, MM74C08, MM74C04, LM 555 and make the connections indicated Figure 27.
c) Prepare the Digilab Rectangular Signal Generator on the 1 Hz frequency.
Figure 28 represents the electrical diagram and the block diagram of the realized circuit.
The operating principle is the same as before ; it is always a question of counting the number of pulses arriving at the entrance of a counter during a determined time.
In the present experience, the frequency measurement is made automatic and repetitive. For this, the monostable is replaced by an oscillator that generates a signal of either 1 Hz or 100 Hz and a divider by four.
As you will see, in this way a measurement is made every four seconds in the first case (oscillator at 1 Hz), and twenty-five measurements per second in the second case (oscillator at 100 Hz).
The counter consists of the 12 stages integrated circuit CD 4040. It is an asynchronous binary counter with an asynchronous reset entry.
Here, eight outputs of the CD 4040 are used and are connected to the two displays DIS0 and DIS1.
The Q10 output of the meter is connected to the rising edge detector installed on the Digilab. Thus, when there is an overflow of the frequency counter, the LED L0 lights up.
The synchronization circuit is formed by three AND gates of the circuit MM 74C08 and by three inverters MM 74C04.
This synchronization circuit provides the various signals necessary for the operation of the counter, the locking of the display and the resetting of the overflow indicator.
10. 2. - OPERATING TEST
a) Switch on the Digilab and observe the displays. They must indicate 01 since the frequency of the signal applied to the input is 1 Hz.
Nevertheless, the accuracy of the time base (signal from the LM 555), as well as that of the clock signal is not very high, it is possible that the display indicates 00 or 02.
b) Arrange the Digilab clock generator at 10 Hz. You must read 0A on the displays, which corresponds to 10 in decimal place. For the reasons mentioned above, you can read 09, 0B, 0C, ...
c) Set the clock generator to 100 Hz. The display should read 6416 or 10010. However, the actual value may differ significantly from this theoretical value.
Until now, the time base of the frequency meter was worth 1 second, see a frequency of 1 Hz. However, with two hexadecimal displays, it is possible to display at most FF16, or 25510. So the capacity of the frequency meter with this base of time is 255 Hz.
To increase this capacity, it is necessary to reduce the time base, therefore to increase the frequency of the signal of the time base.
For this purpose, proceed as follows.
d) Turn off the Digilab.
e) Remove
the link connecting pin 6 of the LM 555 to the positive pin of capacitor C2 and connect this pin 6 to the free end of capacitor C3 as indicated by the dotted line in Figure 27.
f) Arrange the Digilab clock generator on the 1 kHz frequency.
g) Remove from the contact CP1 the connection coming from the pin 9 of the integrated circuit MM 74C08 and introduce it into the contact CP2 as indicated by dashed line Figure 27.
h) Turn on the Digilab and observe the displays. You must read a value close to 0A16, or 1010. The time base is 0.01 seconds or 1 / 100e of that of the previous test, so you must multiply the displayed value by 100 to obtain the real value.
In this case, we get 10 x 100 = 1000 Hz, or 1 kHz.
i) Arrange the clock generator at 10 kHz. The displays must indicate a number close to 6416 or 10010. The actual value is 100 x 100 = 10 000 Hz, see 10 kHz.
j) Arrange the clock generator at 100 kHz. You notice that the LED L0 lights up. Indeed, the maximum capacity of the frequency meter is : 255 x 100 = 25 500 Hz, or 25.5 kHz.
k) With the tests completed, turn off the Digilab.
In order to analyze the operation of this assembly, refer to Figure
28-a as well as to Figure 29 where is reported the chronogram relating to the operation of the frequency meter.
The oscillator part constituted by the LM 555 can generate two rectangular signals, one of 1 Hz with C2, the other of 100 Hz with C3.
This signal, from the LM 555, reaches the flip-flop A which halves the frequency of this signal. We obtain a frequency signal F01 = 0.5 Hz (or 50 Hz) perfectly symmetrical.
This second frequency signal F01 is sent on the second flip-flop B which divides again by two. The output signal
(02)
of this flip-flop B constitutes the time base (0.25 Hz or 25 Hz) of the frequency meter. This signal reaches one of the two inputs of the AND gate 1, while the signal whose frequency is to be measured reaches the other input.
his AND gate validates the input signal, either for 2 seconds (02
= 0,25 Hz), or for 2 / 100e
(02 = 25 Hz).
The signal from this gate is applied to the clock input f
of the CD 4040 counter.
This counting time is noted T2 on the timing diagram.
The synchronization circuit constituted by the three AND gates (2, 3 and 4) and the three inverters (1, 2 and 3) generates three control signals a, b and c. It is a combinatorial network that uses the frequency signals F0, F01,01
and F02.
The signal a is applied to the LATCH inputs LE0 and LE1 of the two displays. When this signal is at level L (time T3), the counting result, present on the outputs of the counter, is memorized and transferred to the displays.
The signal b allows the reset of the counter when it is at the level H (time T1).
The signal c allows the resetting of the flip-flop D used to detect a rising edge (indicator for exceeding the frequency counter). This reset is also performed during the time T1.
The frequency measurement is as follows :
During the period T1, the counter and the overflow lever are reset.
During the time T2, the frequency measurement is carried out, the counter counts the pulses which transit through the AND gate n° 1.
During the instant T3, the counting result is stored by the display circuit.
Then a new measuring cycle starts again.
If during the measurement the count exceeds 8 bits, the counter output Q10 goes to level H and triggers the rising edge detector. In this case, the LED L0 lights up.
You may notice that the Q1 output of the counter is not used. This is explained by the fact that the time base is 2 seconds (time during which the AND gate N°1 is validated) and not 1 second. So, using the outputs Q2 to Q9 of the counter, we count only one pulse out of two, but as the time base is worth 2 seconds and not 1 second, we count well the number of real pulses for a second.
This frequency meter remains quite simple and its accuracy is based essentially on that of the astable oscillator of the integrated circuit LM 555.
Figure 30 shows an example relating to this problem of precision.
In this example, if the timebase is actually 1 second, the displayed result will be 10 Hz, but if it ends at time TA because of a lack of stability, the result will be 9 Hz ; if it ends at the instant TC, the result will be 11 Hz.
For this reason, the oscillator of the time base must be very stable and precise.
In laboratory equipment, the oscillators are controlled by quartz and are temperature stabilized. Thus, the accuracy and stability are very high and the result obtained is very close to reality.
So ends this practice. The next will be dedicated to the review of digital / analog and analog / digital converters.


 Realization of a digital 2 digits Frequency Meter
 Click here for the next lesson or in the summary provided for this purpose.
 Top of page
 Next Page